

Last Updated: June 17th, 2026 by Matthew Brown
Baseball has always been a game of numbers, but today’s statistics look nothing like the back of your 1970s baseball cards. While old-school scouts still trust their eyes and gut feelings, modern metrics are measuring what they’ve always seen, just with decimal points and fancy names. Here’s how the new numbers match up with the old wisdom.
Don't lose this article. Enter your email below, and I'll send it to you right now. Plus, we'll send you other unbelievable stories from baseball's past.
Exit Velocity: When ‘Good Wood’ Gets Scientific
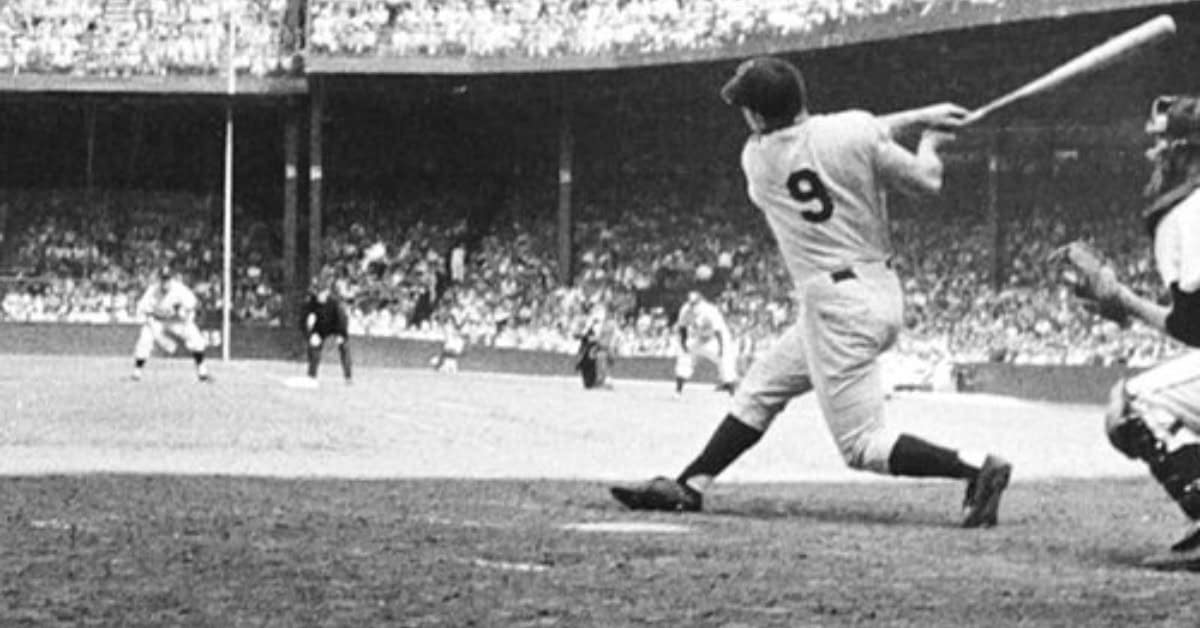
Old-timers could tell when a hitter “really got into one.” Now we know that “good wood” typically means exit velocities above 95 mph. What scouts used to judge by the crack of the bat, Statcast measures down to the decimal point, proving that those veteran eyes knew exactly what they were seeing.
Launch Angle: More Than Just ‘Upper-Cutting’
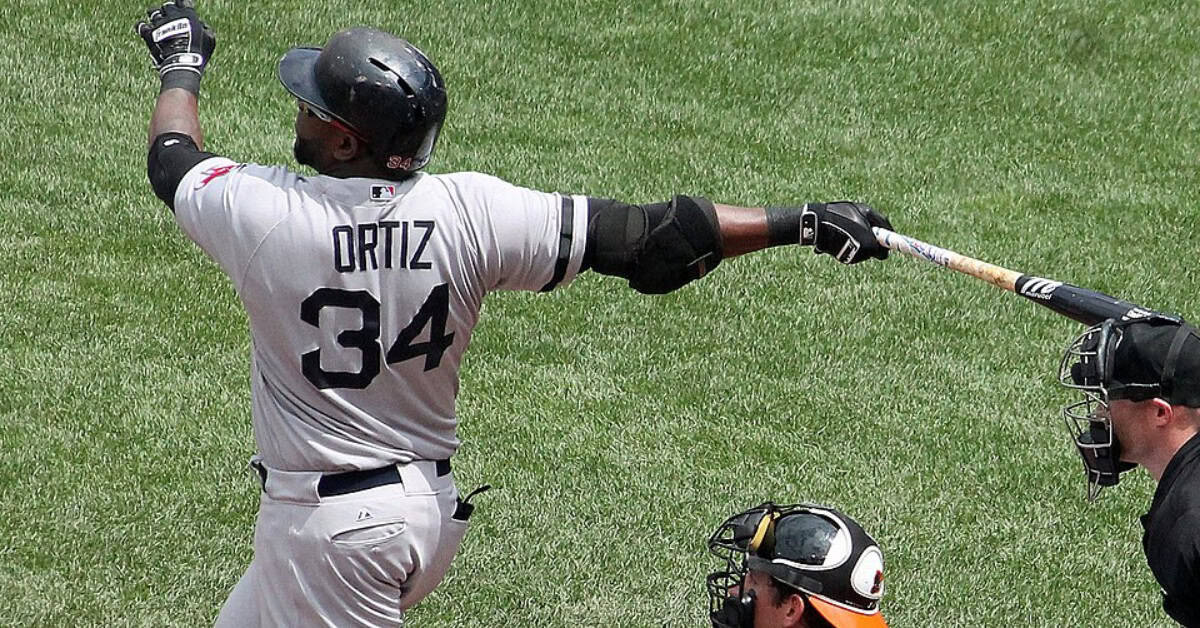
Remember when coaches warned against “swinging up at the ball”? The perfect launch angle (25-35 degrees) is exactly what Ted Williams preached in his “Science of Hitting” back in 1971. Sometimes, the old school was ahead of the curve—they just didn’t have the fancy terminology.
Spin Rate: The Real Reason Curveballs ‘Drop Off the Table’

Old scouts could spot a “12-to-6” curve from the bleachers. Now we know that nasty break they identified comes from spin rates above 2,600 rpm. The numbers just confirm what good eyes have always known – some pitchers just have that special snap in their wrist.
Defensive Runs Saved: Beyond the Eye Test
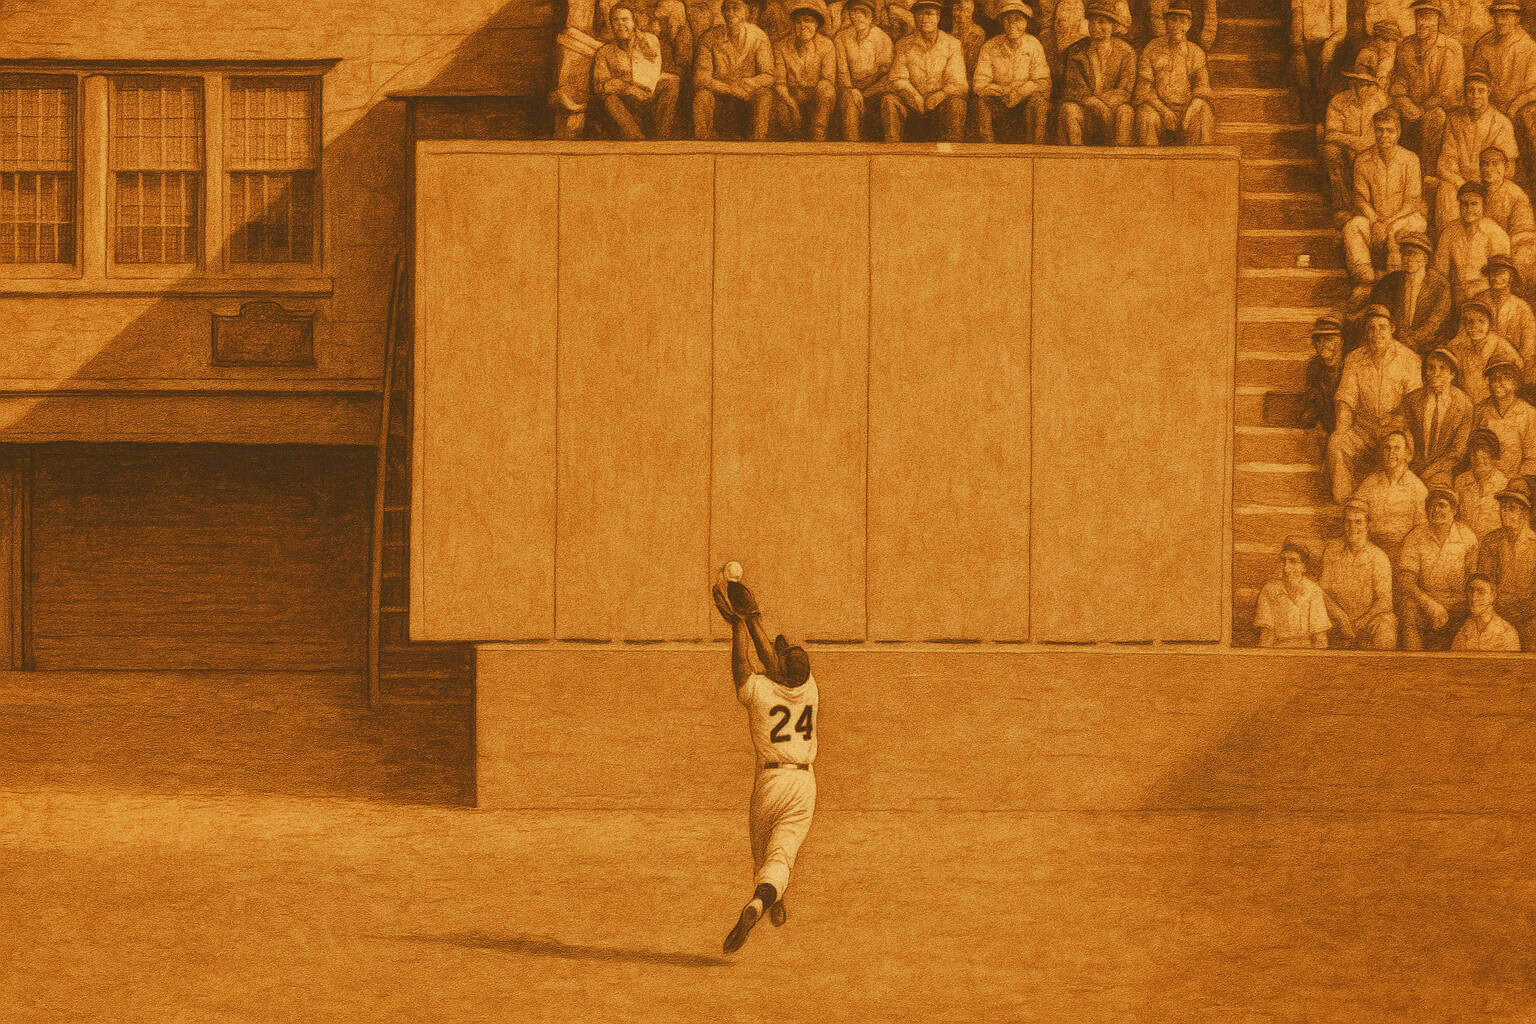
Scouts used to say certain fielders “saved a lot of runs with their glove.” DRS finally puts a number on that observation, measuring exactly how many runs a fielder prevents compared to average. It’s just quantifying what good baseball men have always seen from the stands.
WAR: Why ‘Five-Tool Players’ Isn’t Enough Anymore
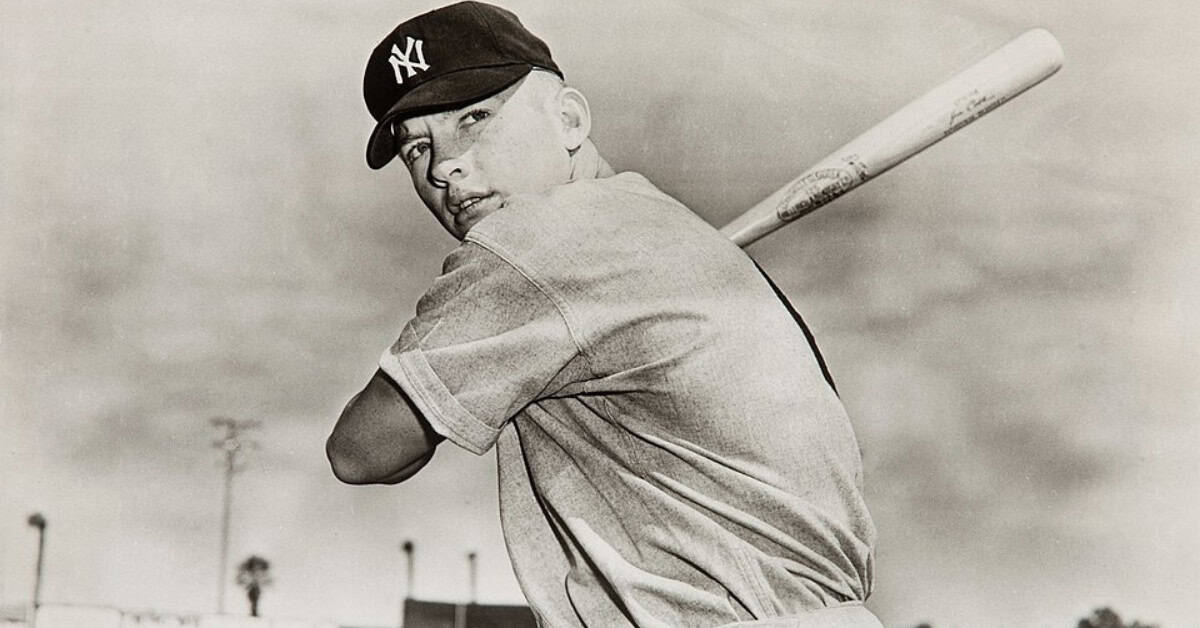
Wins Above Replacement might sound complicated, but it’s really just measuring what scouts meant by “complete ballplayer.” It combines everything from hitting to fielding to baserunning into one number, telling us exactly how much a player helps his team win.
Hard-Hit Percentage: Quantifying ‘Good Contact’
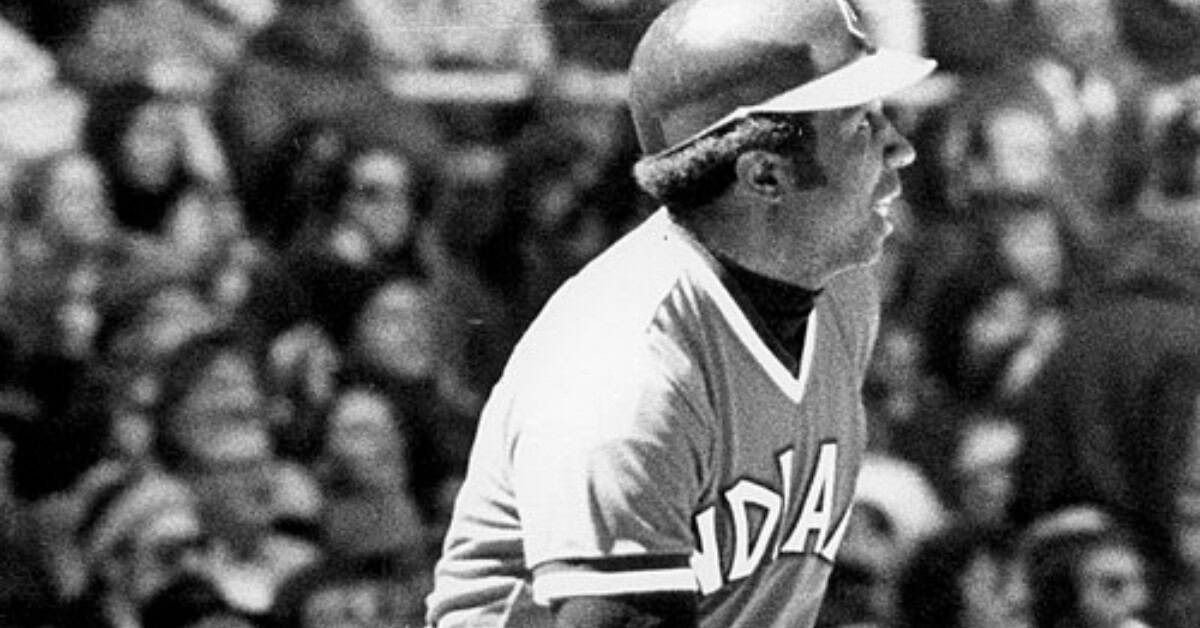
Old-time scouts could tell you which hitters “really squared it up” consistently. Now we track the percentage of batted balls hit 95+ mph, proving that those weathered eyes in the stands knew quality contact when they saw it. The computers just added precision to perception.
Pitch Framing: The Art of ‘Good Target’ Gets Measured

Scouts always valued catchers who could “help their pitchers get calls.” Today’s framing metrics prove they were right – some catchers can steal dozens of strikes a season with subtle glove work. The eye test just got backed up from the computers.
Chase Rate: More Than Just ‘Bad Ball Hitter’

Vladimir Guerrero Sr. could “hit anything near the plate” – now we can measure exactly how often batters swing at pitches outside the zone. Chase rate validates what scouts saw in players with “good eyes” versus those who would “swing at anything.” The numbers just make it official.
Expected Batting Average: Beyond ‘Hitting It Where They Ain’t’

Scouts knew some hitters were “snake-bit” despite good contact. xBA proves they were right by calculating a player’s average based on how they hit the ball. It’s just putting numbers to what baseball men meant when they said someone was “hitting in tough luck.”
Barrel Percentage: The Science Behind ‘Sweet Spot’

The “sweet spot” has gone high-tech. Barrel percentage measures how often a batter achieves the perfect combination of exit velocity and launch angle. It’s just confirming what scouts meant when they said someone had a “pretty swing” – now we just know exactly how pretty.